
- Parameters
- Batch Drill Down
- Batch Movement
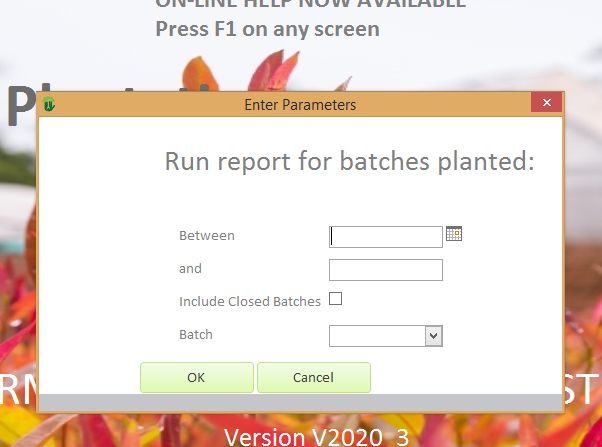
Batch Reports Parameters
| Field | Description |
| Between | Enter start date for range of batches to include |
| and | Enter End date for range of batches to include |
| Include Closed Batches | Select if you wish to include batches which have been marked as closed |
| Batch | Select either a specific batch meeting the above criteria or ALL batches meeting the above critieria |
| Click to run the report | |
| Click to cancel |
Batch Drill Down

The reports prints the detail for every batch selected in the parameters form. In the above example these are open batches planted between the 1 Jan 20 and the 10 Jan 20.
The report follows the detailed events occurring to the batch over its lifespan showing both processes and adjustments and the net stock of the batch at each step. It also follows the movements of the batch through the nursery.
| Field | Description |
| Batch : | The batch number |
| Date | The date on which the applicable process or adjustment occurred |
| Type | The type of process or adjustment |
| Tray Type | The resulting tray type used |
| Tray Density | The resulting tray density |
| Tray Qty | The quantity of trays applicable to the process or adjustment |
| Plants | The quantity of the plants involved in the process or adjustment. A negative means a decrease of plants in the area and a positive number means an increase of plants in the area. |
| Location | The sub location in the area where the process or adjustment occurred |
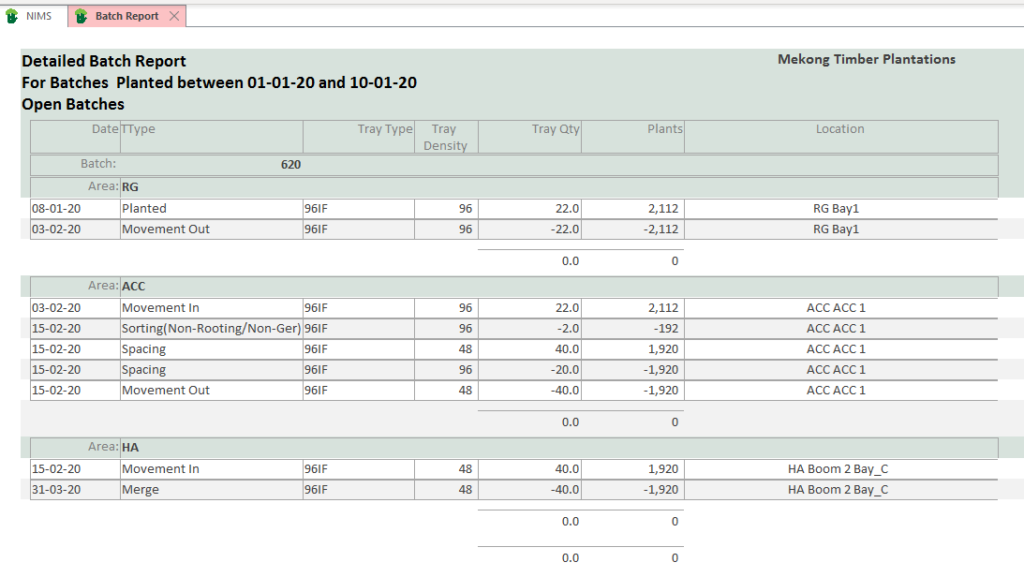
The above batch was planted on the 8/1/20. It remained in the Greenhouse for 25 days before being moved to the acclimatizing(ACC) area. After spending 12 days in the ACC area the batch was sorted and the tray spacing adjusted. In the process the batch lost 92 plants or 2 trays due to non-rooting and the tray cells were spaced at a 50% density resulting in 40 trays of 48 plants each. These sorted trays were then moved into the holding area on the same day.
Here they spent another 2 weeks before being merged into another batch.
Movement Report

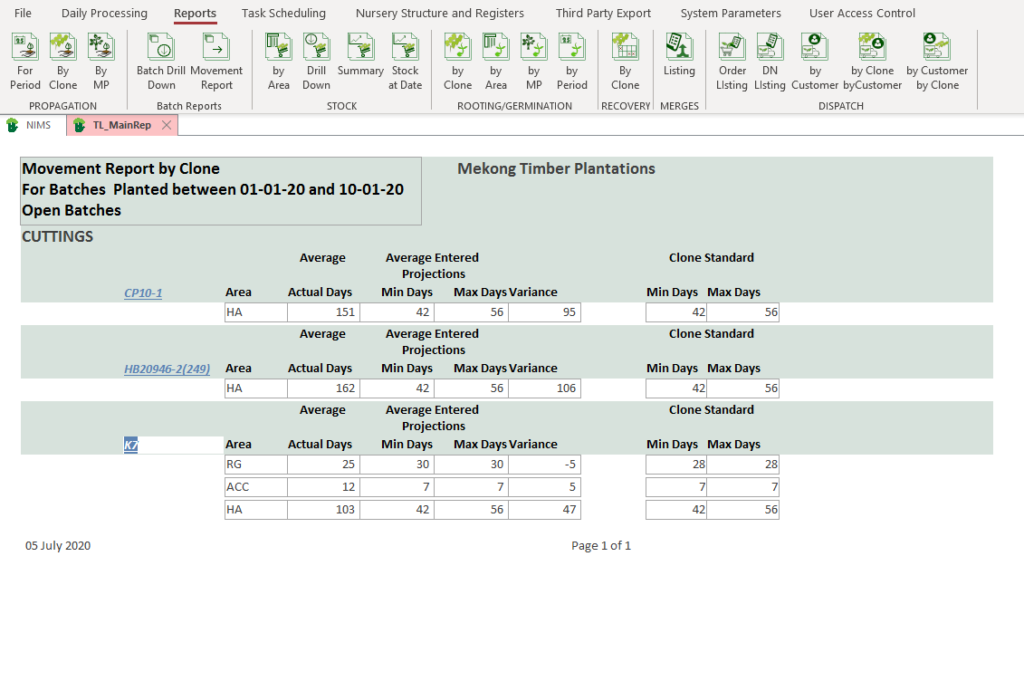
The movement reports shows the average stay of a batch in a specific area by clone. This is to allow the user to manage the movements of the batches between areas. Although in our example, the report is after the fact, it still helps us to see what happened historically.
The report is meant to be used as a real time report allowing the Nursery manager to see which batches are ready to move.
A note on Projections in NIMS
NIMS for ease of capture allows you to set up projections by clone. As you create batches, NIMS will automatically copy these master projections to the batch. These can then be edited if necessary giving you micro projection management of your batches.
Although NIMS will show the clone standard, it calculates averages using the projections linked to the batch, allowing for more accurate and relevant projections reports.
The format of the report is a drill down allowing you to drill down to the individual batches on the next level.
| Field | Description |
| Clone | The clone or seed id |
| Area | The report will show data per area for each Clone or SeedLot |
| Average Actual Days | This would be an average days spent in this area for all batches of this clone to date. |
| Average Entered Projections | |
| Min Days | This is the average of entered min day projections for the clones which have moved through the area to date. |
| Max Days | This is the average of entered max day projections for the clones which have moved through the area to date. |
| Variance | This is the variance of the actual average to the calculated average projections. If the variance is negative this would mean that the average actual is below the min expected days. If the variance is positive this would indicate an average of above the max expected days. If zero then the batches have on average been in the areas for the expected amount of days. |
| Clone Standard | |
| Min Days | The minimum days expected for this clone |
| Max Days | The maximum days expected for this clone |
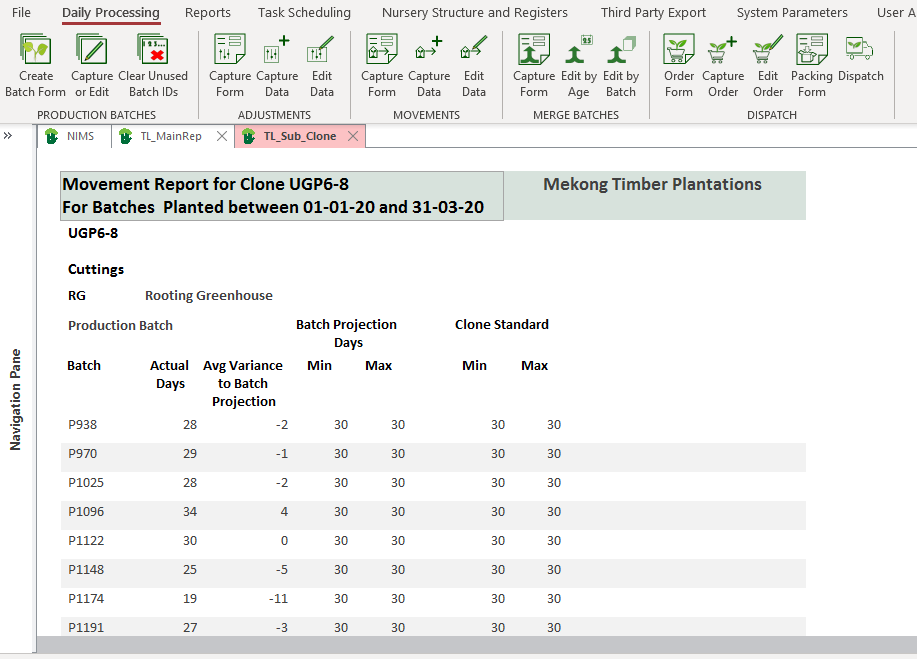
As mentioned the movement report is a drill down so that you can see the batch details of the clone summary.
| Field | Description |
| Batch | The batch number |
| Actual Days | The actual days spent in the applicable area. |
| Avg Variance to Batch Projection | This is the variance of the actual days to the captured batch projection |
| Batch Projection Days | |
| Min Days | This is the min days captured for this specific batch number |
| Max Days | This is the max days captured for this specific batch number |
| Clone Standard | |
| Min | This is the min expected days in the area as per the clone master |
| Max | This is the max expected days in the area as per the clone master |